We believe you can go further and do more when you have a trusted risk-discussion partner on your team, who will look at your business holistically to uncover new opportunities.
We are a leading global reinsurer that helps insurance companies reduce their earnings volatility, strengthen their capital and grow their businesses through reinsurance solutions.
Steffen Münch, Catastrophe Researcher, presents the results of a recent PartnerRe analysis that highlights the potential to significantly underestimate tornado risk if the third dimension of tornado clustering – intensity clustering – isn’t also taken into account.
Though US severe convective storms (SCS) are often perceived as a frequency peril, the recent tornado outbreak of December 10-11, 2021, with 60 observed tornadoes, 8 of which were estimated to be of highly destructive intensity (>= EF31), was a poignant reminder that SCSs can cause loss of life and lead to severe industry losses.
In fact, as shown in figure 1a), our analysis of tornado outbreaks from 1997-20202, shows that the clustering of tornadoes in time and space is not the exception, it is the norm. Indeed, many outbreaks in recent history have included large numbers of tornadoes, the most extreme example being the April 25-28, 2011 outbreak, with its staggering 528 tornadoes. This outbreak led to insured losses of over USD 10 billion (trended to today’s value3).
Figure 1: The majority of tornadoes occur in clusters of time and space. 1a) shows the results of our cluster analysis of the NOAA Storm Prediction Center (SPC) tornado record from 1997-2020, in which we group tornadoes that occurred in proximity to one another within a maximum distance of 100 km and with less than 3 hours separating each individual tornado. This showed that 80% occur in clusters, with 4% occurring in clusters of more than 70. 1b) shows the tornado outbreak of April 25-28, 2011, with the largest identified cluster highlighted. 1c) shows the tornado outbreak of December 10-11, 2021, with the largest identified cluster highlighted. The paths of the severe convective storms that generated the tornadoes in 1b) and 1c) are clearly visible. Source: PartnerRe.
Beyond clustering in time and space, if we turn now to tornado intensity, our analysis also showed that 9 – i.e. almost half – of the 20 EF5 (incredible damage) tornadoes from the period 1997-2020 occurred in a single outbreak, the outbreak of April 25-28, 2011 (figure 1b)). Simply knowing that there have been 20 EF5 tornados recorded in 24 years and roughly equating this to an occurrence of 1 EF5 tornado per year would be an incorrect interpretation that would seriously underestimate the potential loss to a portfolio. It is clear, therefore, that risk assessment needs to capture the full nature of tornado clustering, i.e., clustering not just in time and space, but also in intensity.
At PartnerRe, the continued development of our proprietary CatFocus® US Severe Convective Storm Model enables us to robustly model this risk taking all clustering dimensions into account. Our model includes a 10,000-year event set of tornado outbreaks, for which the occurrence probability is based on environmental parameters4 and which simulates SCS outbreaks with 44 million physically reasonable synthetic hail and 14 million tornado footprints. For the tornadoes, we have implemented a clustered sampling approach in the model, informed by the last 40 years of observation data.
To show the impact of including intensity clustering, we carried out a model sensitivity analysis using the CatFocus® US Severe Convective Storm model event set, see figure 2 below. This shows how including clustered intensity sampling in modeling leads to a far better representation of the observed EF>=3 tornadoes from 1997 to 2020. Applying industry (all US residential) exposure, the estimated 100-year event loss increased by 60% when intensity clustering was included. We find that SCS risk is significantly underestimated (and more so at longer return periods) in modeling without a clustered tornado sampling approach.
Figure 2: : Results of our model sensitivity analysis into the impact of tornado intensity clustering. All three pie charts show the distribution of highly destructive tornadoes of intensity EF >= 3 only, using the same grouping criteria as in figure 1. 2a) observed clustering of EF>=3 tornadoes in the NOAA Storm Prediction Center (SPC) 1997-2020 record. 2b) 10,000-year modeled event set in CatFocus® using clustered intensity sampling methods. 2c) modeled event set without clustered intensity sampling methods; this is the same event set as 1b), but after randomly reordering the intensities of all tornadoes to eliminate clustering in intensity, while maintaining clustering in time and space. As 2a) shows, 77% of EF >= 3 tornadoes from observation 1997-2020 occurred in clusters. This is mirrored most closely in 2b), i.e., in the CatFocus® modeled event set using clustered sampling methods, with 81% occurring in clusters. However, as 2c) shows, without clustered intensity sampling only 28% occur in clusters. Clustered intensity sampling is therefore critical in order to avoid an underestimation of this risk. Source: PartnerRe.
The December 10-11, 2021 tornado outbreak was a devastating reminder of the destructive potential of SCSs. Based on our analysis, such events are to be expected. By taking the clustering of tornadoes in time, space and intensity into account, the CatFocus® US Severe Convective Storm Model is fit for purpose to provide robust and reliable risk of loss assessment for US Property portfolios.
Contributors
Dr. Steffen Münch, Researcher, Catastrophe Research
Dr. Martin Frischknecht, Researcher, Catastrophe Research
Dr. Paul Della Marta, Head of Catastrophe Research
Contact us for more information
If you would like more information on our CatFocus® US Severe Convective Storm model or tornado outbreak analysis, please don’t hesitate to get in touch with us, we would be very happy to set up a meeting to discuss this work with you and to help you consider the impact on your own portfolio.
This article is for general information, education and discussion purposes only and does not constitute legal or professional advice.
References
1 The intensity of tornadoes is characterized by their destructive potential on the Enhanced Fujita (EF) scale that ranges from 0 (light damage) through to 3 (severe damage) to 5 (incredible damage).
3 Property Claims Services (PCS) industry loss estimate, trended to today’s value by PartnerRe using exposure growth data (census.gov) and average claim size changes (PCS). PCS (Property Claims Service), a division of Verisk. Not for distribution without the permission of PCS. For more information, please contact Tom Johansmeyer, [email protected].
4 Environmental conditions from the North American Regional Reanalysis (NARR), i.e., numerical weather prediction model output to best capture observed weather conditions (Mesinger et al., 2006, BAMS). The approach for calculating tornado occurrence probability is based on accumulated convective precipitation and storm relative helicity following Tippett et al. (2012; doi:10.1029/2011GL050368).
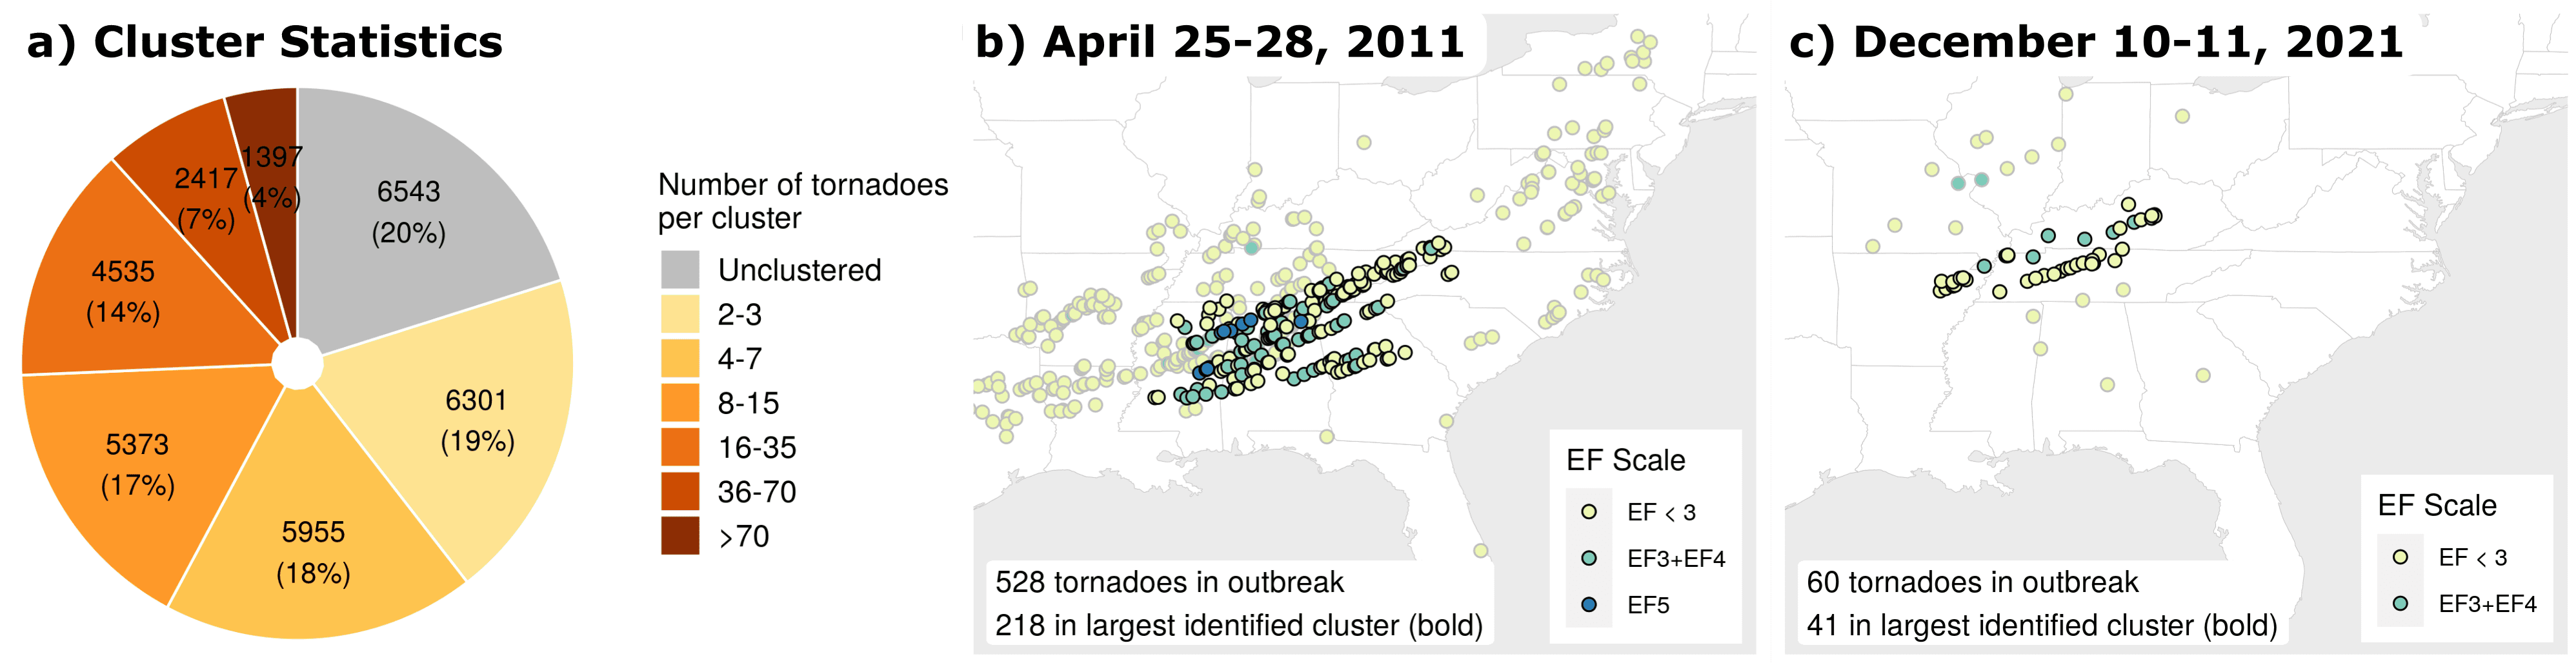 Figure 1: The majority of tornadoes occur in clusters of time and space. 1a) shows the results of our cluster analysis of the NOAA Storm Prediction Center (SPC) tornado record from 1997-2020, in which we group tornadoes that occurred in proximity to one another within a maximum distance of 100 km and with less than 3 hours separating each individual tornado. This showed that 80% occur in clusters, with 4% occurring in clusters of more than 70. 1b) shows the tornado outbreak of April 25-28, 2011, with the largest identified cluster highlighted. 1c) shows the tornado outbreak of December 10-11, 2021, with the largest identified cluster highlighted. The paths of the severe convective storms that generated the tornadoes in 1b) and 1c) are clearly visible. Source: PartnerRe.
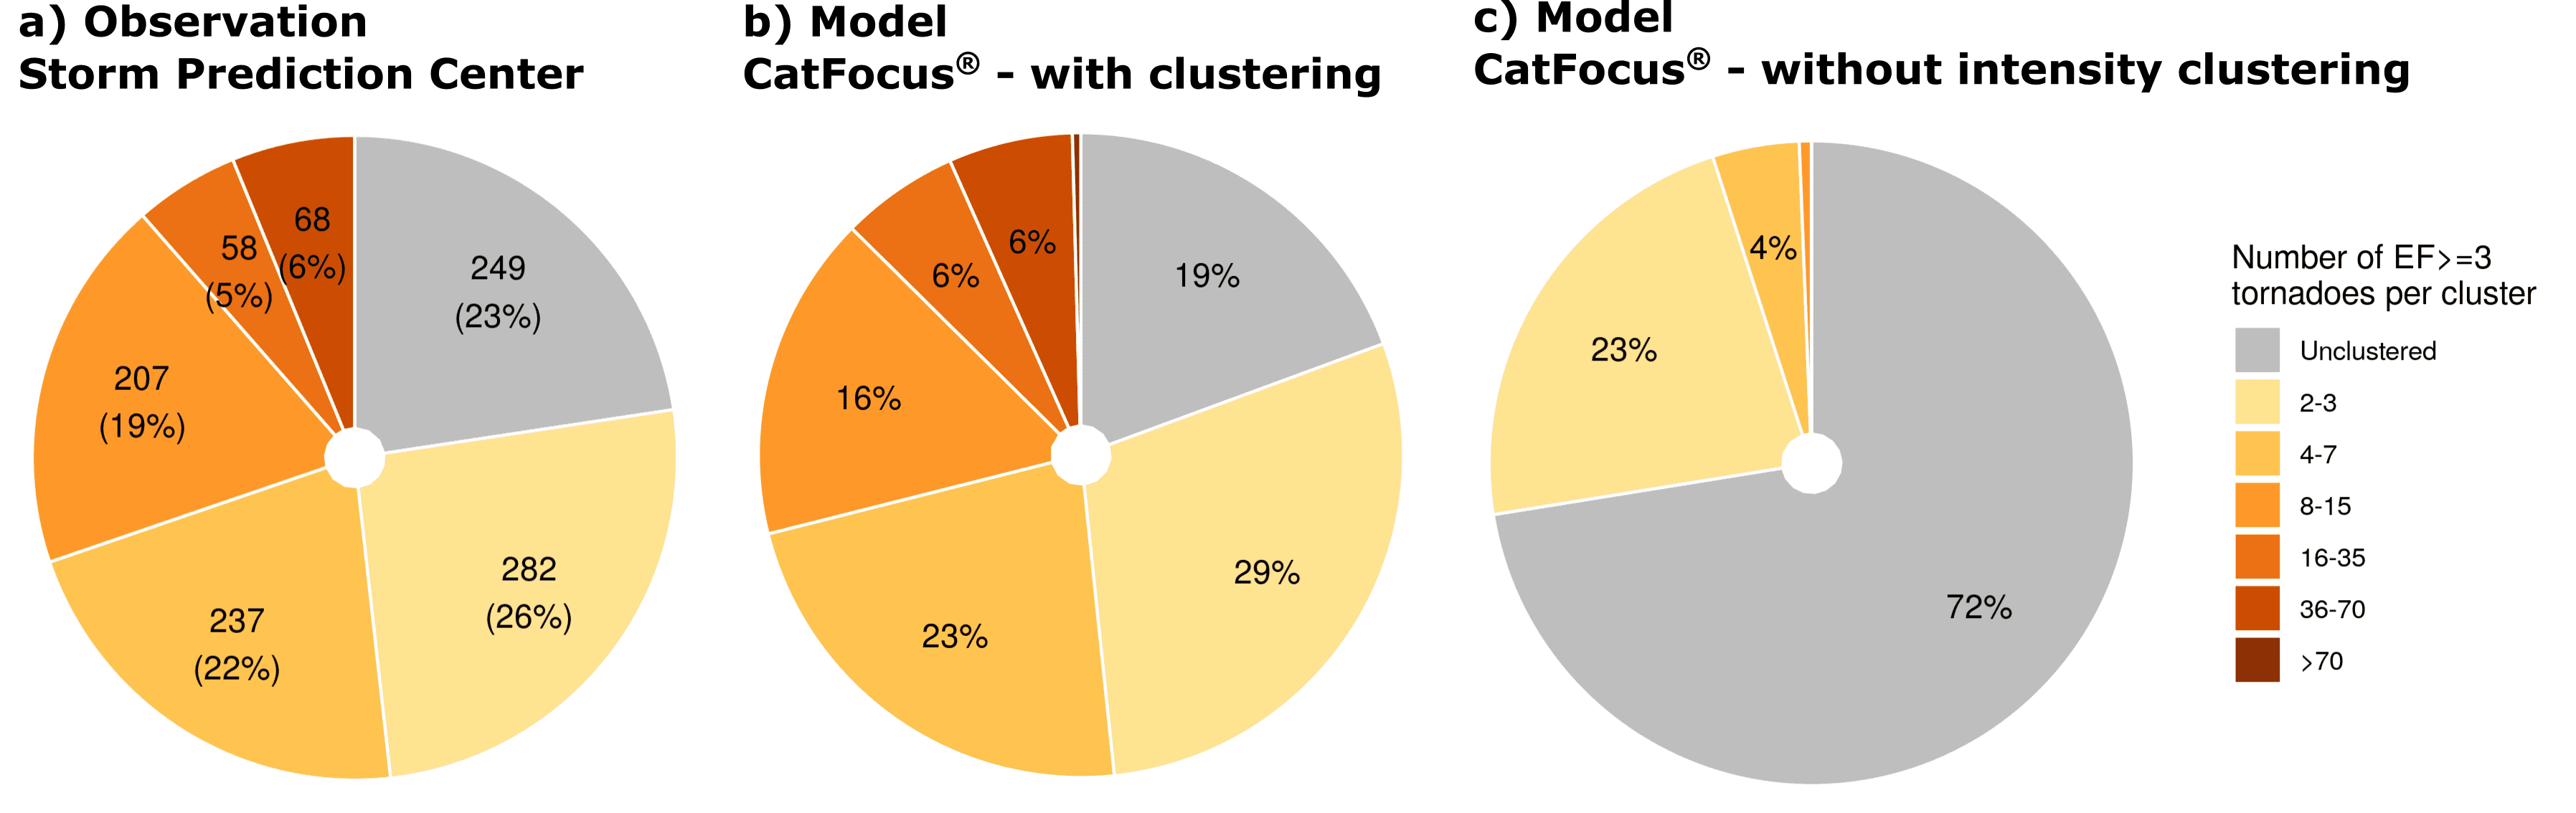 Figure 2: : Results of our model sensitivity analysis into the impact of tornado intensity clustering. All three pie charts show the distribution of highly destructive tornadoes of intensity EF >= 3 only, using the same grouping criteria as in figure 1. 2a) observed clustering of EF>=3 tornadoes in the NOAA Storm Prediction Center (SPC) 1997-2020 record. 2b) 10,000-year modeled event set in CatFocus® using clustered intensity sampling methods. 2c) modeled event set without clustered intensity sampling methods; this is the same event set as 1b), but after randomly reordering the intensities of all tornadoes to eliminate clustering in intensity, while maintaining clustering in time and space. As 2a) shows, 77% of EF >= 3 tornadoes from observation 1997-2020 occurred in clusters. This is mirrored most closely in 2b), i.e., in the CatFocus® modeled event set using clustered sampling methods, with 81% occurring in clusters. However, as 2c) shows, without clustered intensity sampling only 28% occur in clusters. Clustered intensity sampling is therefore critical in order to avoid an underestimation of this risk. Source: PartnerRe.