We believe you can go further and do more when you have a trusted risk-discussion partner on your team, who will look at your business holistically to uncover new opportunities.
We are a leading global reinsurer that helps insurance companies reduce their earnings volatility, strengthen their capital and grow their businesses through reinsurance solutions.
PartnerRe Review of LexisNexis® Risk Classifier with Medical Data – Combined Model Indicates Greater Predictive Value
SHARE
PartnerRe’s analytics experts evaluated the Life predictive model, LexisNexis® Risk Classifier with Medical Data. Here we present the results of our objective and detailed review of the model. For more information, please contact us via the links at the end of this report.
Executive summary
Predictive models can offer considerable value in streamlining Life underwriting.
LexisNexis Risk Solutions and ExamOne have collaborated to build a combined model – Risk Classifier with Medical Data – that incorporates data from their separate mortality risk models; LexisNexis® Risk Classifier and ExamOne’s HealthPiQture.
PartnerRe’s independent evaluation of the combined and constituent models – as presented in this report – found that the combined model has higher predictive power and therefore would add value over and above the usage of either of the constituent models individually.
Objectives
Over the past several years, carriers have focused on streamlining the underwriting process, and there has been a growing use of new data sources and predictive models. However, often, these predictive models only incorporate a particular category of data (e.g. behavioral, medical, clinical) and carriers have been tasked with combining outputs from these models to arrive at an overall underwriting assessment.
In an effort to provide a more robust and comprehensive predictive model solution, LexisNexis Risk Solutions and ExamOne collaborated to build a combined model that incorporates data from their separate mortality risk models. While Risk Classifier uses public records, credit attributes, and driving history, ExamOne’s HealthPiQture is built on medical data and uses three composite scores: 1) prescription history from ScriptCheck; 2) clinical tests from LabPiQture; and 3) diagnosis codes from LabPiQture and/or medical claims. Scores from both models are correlated with mortality, while using quite different data sources. Consequently, with a combined model, we would expect an incremental increase in our ability to assess an applicant’s mortality risk.
LexisNexis Risk Solutions and ExamOne provided the data necessary for PartnerRe to carry out an independent assessment of the performance of the combined model: Risk Classifier with Medical Data.
First, we evaluated the degree of overlap between the two individual models (i.e., Risk Classifier, HealthPiQture1). Second, we contrasted the mortality and distributional trends among the three models. Finally, we compared risk segmentation among the three models and statistically tested for the incremental validity of Risk Classifier with Medical Data.
Evaluation data
We evaluated Risk Classifier with Medical Data using data provided by LexisNexis Risk Solutions – approximately 2 million depersonalized records. These data are a sample of the larger data set from LexisNexis and ExamOne created for the purposes of model development – they are records for which both companies had information. These sample data included, but were not limited to: exposure, expected deaths, a death flag, demographic information for each record (i.e., sex, age), score for the Risk Classifier model, score for the HealthPiQture model, and the score from the Risk Classifier with Medical Data model. There were nearly 52,000 deaths and 10.6 million person-years of exposure. The one-year death rate was 0.0049 and the mortality expectation relative to 2015 VBT (Actual/Expected Deaths) was 2.46. Finally, 48.6% of the sample are men, the median age is 46 (mean is 46.1), with a minimum age of 18 and maximum age of 79. The median exposure is 4.6 years (maximum is 12).
Results
Overlap of the constituent models
Since both scoring systems are associated with mortality, do they provide redundant information? If a model adds incremental value over and above another model/data source, it should not be redundant.
We first examined the degree of agreement between the individual models (i.e., Risk Classifier, HealthPiQture). Will these two models flag the same records as high risk? To assess the degree of agreement, we used an arbitrary cut point to classify records as high versus low risk – the lower 25% of scores ranked from Risk Classifier and the upper 25% ranked from HealthPiQture. In the Venn Diagram below, Figure 1, these scores are weakly correlated (R2 = 0.14). In most cases, the models would differ in which cases are flagged as high risk. Using our arbitrary cut point, only 18.1% of the records flagged would be flagged by both models as high risk. The remaining records that are flagged would be split nearly equally between the models – 41% being flagged by HealthPiQture and 40.9% flagged by Risk Classifier. The models are capturing different aspects of risk (behaviorally and medically relevant).
Figure 1: Number (and percent) of cases selected uniquely and jointly by each model. The numbers (and percentages) reflect cases flagged by using the 25% “highest” risk. Source: PartnerRe.
Because of limited overlap between these models, each should provide incremental validity over and above the other.
Mortality and score distributions
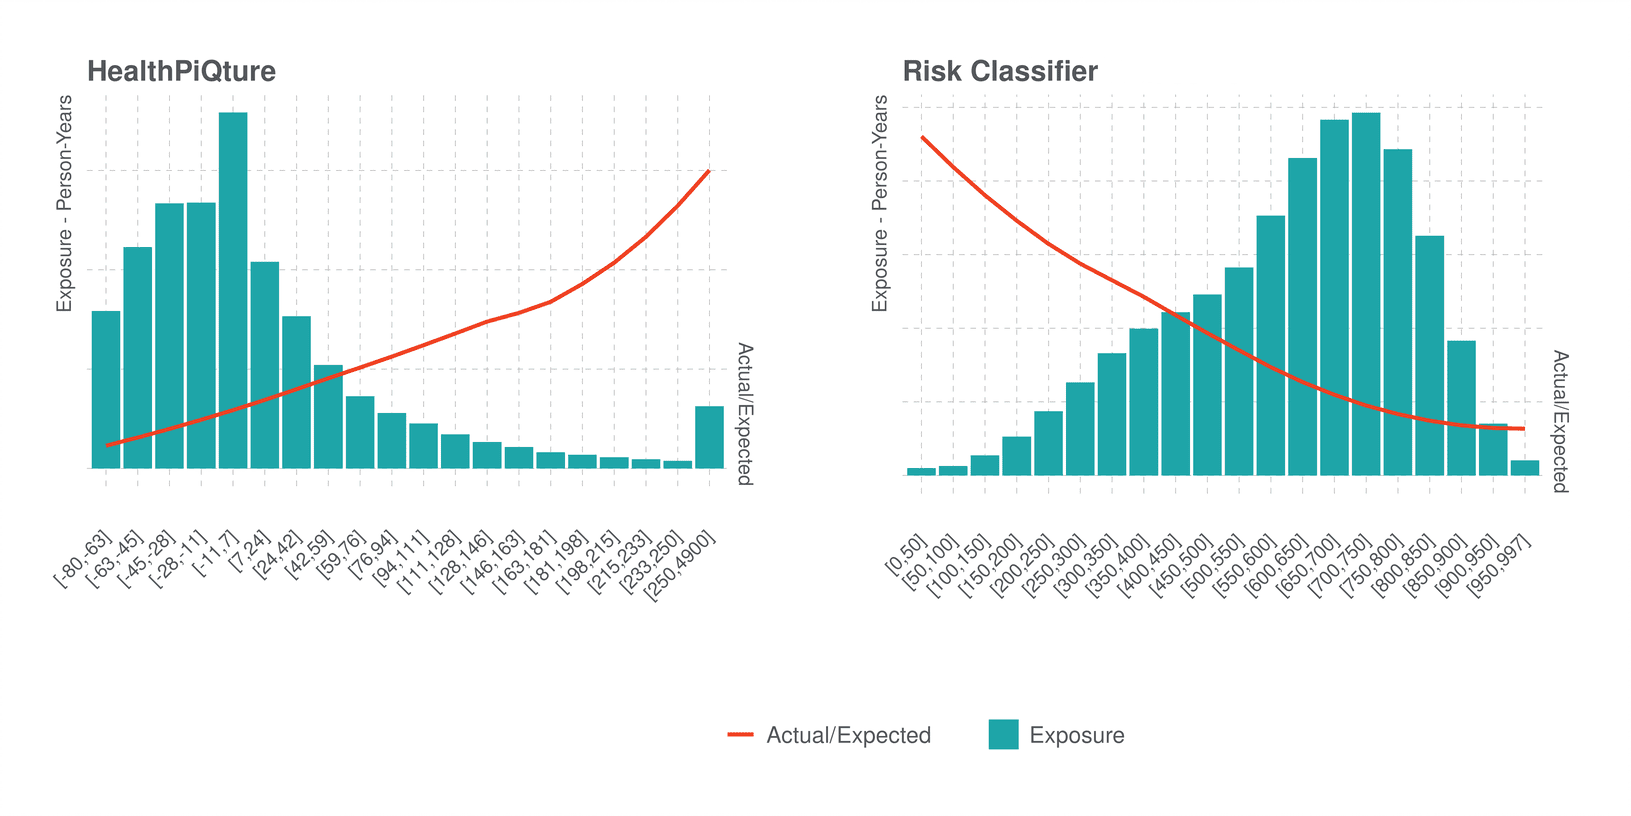
Recognizing that the individual models were not redundant, we next looked at their mortality expectations (Actual/Expected Deaths, A/E) and score distributions. In the bar chart below, Figure 2, we show that scores from HealthPiQture have a right-skewed distribution – most of the records have lower scores and mortality increases with score value (red line). Risk Classifier does have a similar pattern (albeit scored in the reverse) – higher scores relate to decreasing mortality and the data are also skewed (left).
Figure 2: Distribution of scores from HealthPiQture and Risk Classifier. Bars show the exposure in person-years. The red line shows the trend of Actual/Expected Deaths (A/E) relative to the 2015 VBT. Source: PartnerRe.
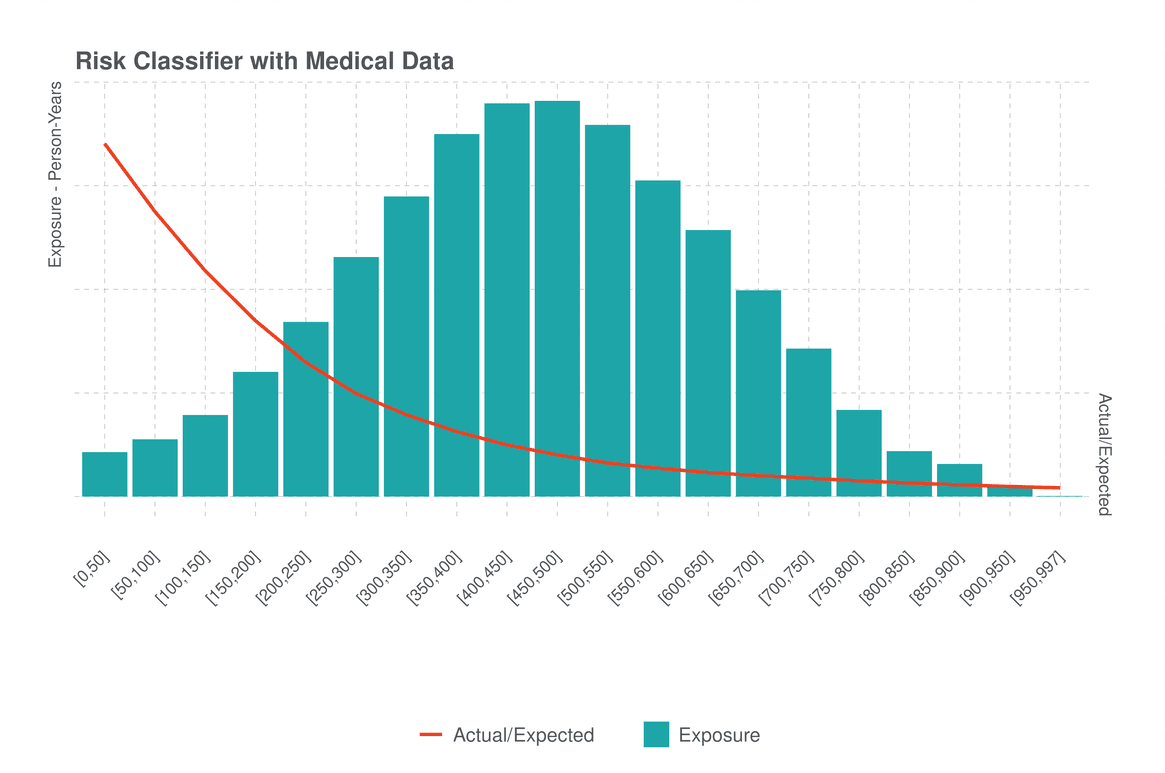
As shown in Figure 3 below, for Risk Classifier with Medical Data, the distribution of scores is normal/bell-shaped and there is evidence that this model better segments risk. First, the range in A/E is much greater than in either of the individual models (reaching much higher risks as low scores and much lower risks as higher scores relative to either of the other models). Second, the mortality slope is generally steeper for the higher risk cases (i.e., score <500) when we compare to either HealthPiQture or Risk Classifier. Consequently, we can conclude that Risk Classifier with Medical Data does segment risk more strongly than either of the individual models. However, if we examine scores above 500, it does appear that the slope is more gradual, which is where the A/E in the sample is below average – albeit achieving lower A/E than Risk Classifier or HealthPiQture.
Figure 3: Distribution of scores from the combined model Risk Classifier with Medical Data. The standardized Actual/Expected Deaths (A/E) is based on 2015 VBT and does account for exposure. Source: PartnerRe.
Incremental Validity of Risk Classifier with Medical Data
To address the question of whether Risk Classifier with Medical Data provides better segmentation than either of the constituent models, we ran a series of cox-proportional hazard models controlling for age and gender and entering the vendor models consecutively. We used the c-index – a measure of model fit that determines how well ranked risk scores match the risk associated with them – to compare the performance of these models. A baseline model with only age and gender has a c-index of 0.77, which is quite comparable to other similar datasets. Models with Risk Classifier and HealthPiQture each respectively have c-indexes of 0.80 and 0.79. A final model with Risk Classifier with Medical Data has a c-index of 0.83. Because the cox-proportional hazard model using scores from Risk Classifier with Medical Data has the highest c-index, we can conclude that it is statistically more powerful than either of the constituent models, though it is difficult to determine by how much.
We scored each record using the cox-proportional hazard models described above – for each of the vendor models, controlling for age and gender. When interpreting the risk scores from these cox-proportional hazard models, we assumed that for any two records, the record with the higher risk score, with all things being equal, would be at risk of mortality sooner than the other.
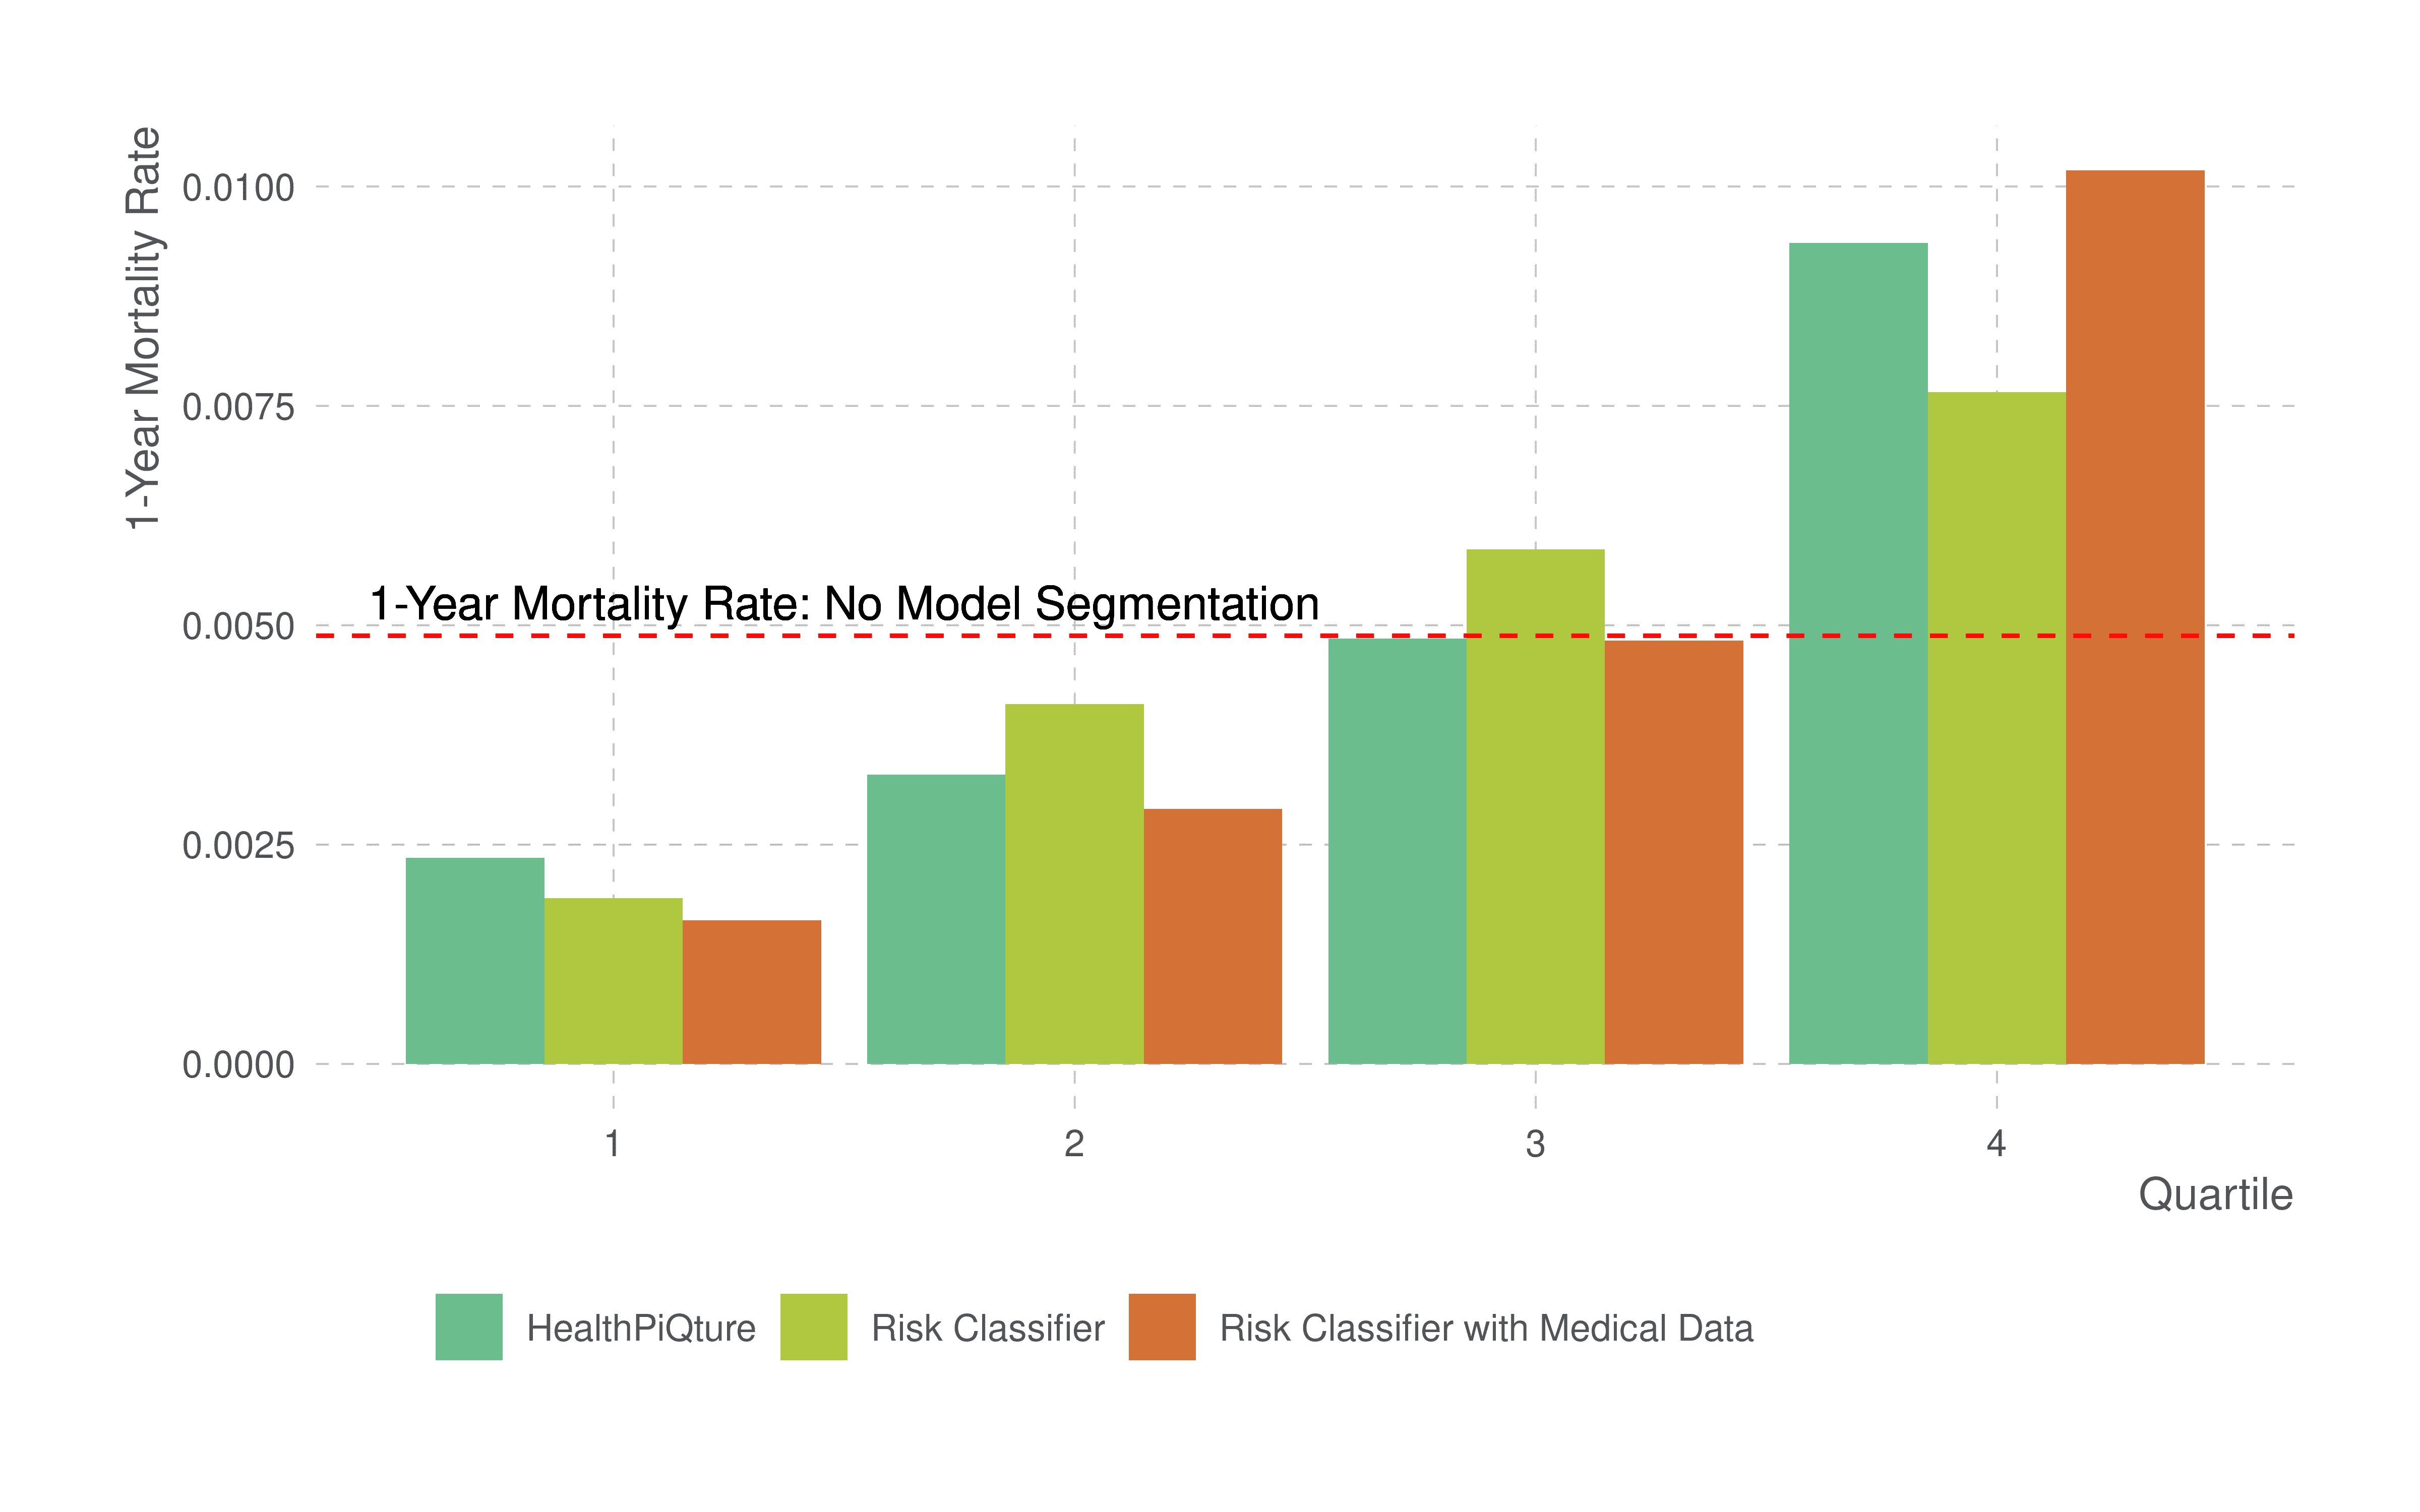
We further ranked the risk scores and assigned them to one of four quartiles (25% segments of risk). Figure 4 shows the ranked risk scores from the three models. In all cases, we display the one-year mortality rate (i.e., number of deaths divided by the person-years of exposure) by the quartiles of scores. The horizontal line shows the one-year mortality rate of 0.0049, which is the mortality rate in the analyzed dataset if we did not segment risk using a model.
Figure 4: One-year mortality rates for each model by quartile. Red-horizontal line shows one-year mortality rate without model segmentation. Each of the other models are respectively displaying the one-year mortality rate by quartile. Source: PartnerRe.
While the highest mortality rates are seen in the highest quartile (Q4) and the lower rates are seen in the lowest quartile (Q1), each model segments the risk slightly differently. There is greater segmentation in the Risk Classifier with Medical Data than in either of the other models, and this is evidenced by lower mortality rates in Q1 and higher mortality rates in Q4. Accordingly, by using Risk Classifier with Medical Data, one can have greater confidence that persons classified in a low-risk group have fewer deaths, and that those in a high-risk group have much higher mortality than those classified by the constituent models. That is, Risk Classifier with Medical Data does segment risk much better than either Risk Classifier or HealthPiQture and therefore has incremental predictive power above and beyond either of its constituent models.
Conclusion
The overall predictive value of Risk Classifier with Medical Data is greater than either of the individual models created by LexisNexis Risk Solutions or ExamOne independently. With the use of both medical and behavioral data, this combined model is better able to segment mortality risk – supporting the adage that “the whole is greater than the sum of its parts.”
Experience can vary by carrier, and carrier score distributions may differ from what we have presented in this report. Thus, in implementing this tool, carriers should consider conducting analyses to understand the impact on each unique environment as it relates to scores, other requirements and product pricing – using thresholds informed by the carrier’s experience.
Contributors
Tom Fletcher, PhD., VP, Data Analytics, North America Life
Jody Daniel, PhD., Data Scientist, North America Life
This Article is for general information, education, and discussion purposes only. It does not constitute legal or professional advice, or a corporate endorsement, position or preference with respect to any product addressed in the Article. PartnerRe accepts no liability as a result of any reliance you may have placed or action taken based upon the information outlined in this Article.
1 In a separate analysis, we took a deep dive in to ExamOne’s HealthPiQture model. The findings from this work will presented in an upcoming white paper.