We believe you can go further and do more when you have a trusted risk-discussion partner on your team, who will look at your business holistically to uncover new opportunities.
We are a leading global reinsurer that helps insurance companies reduce their earnings volatility, strengthen their capital and grow their businesses through reinsurance solutions.
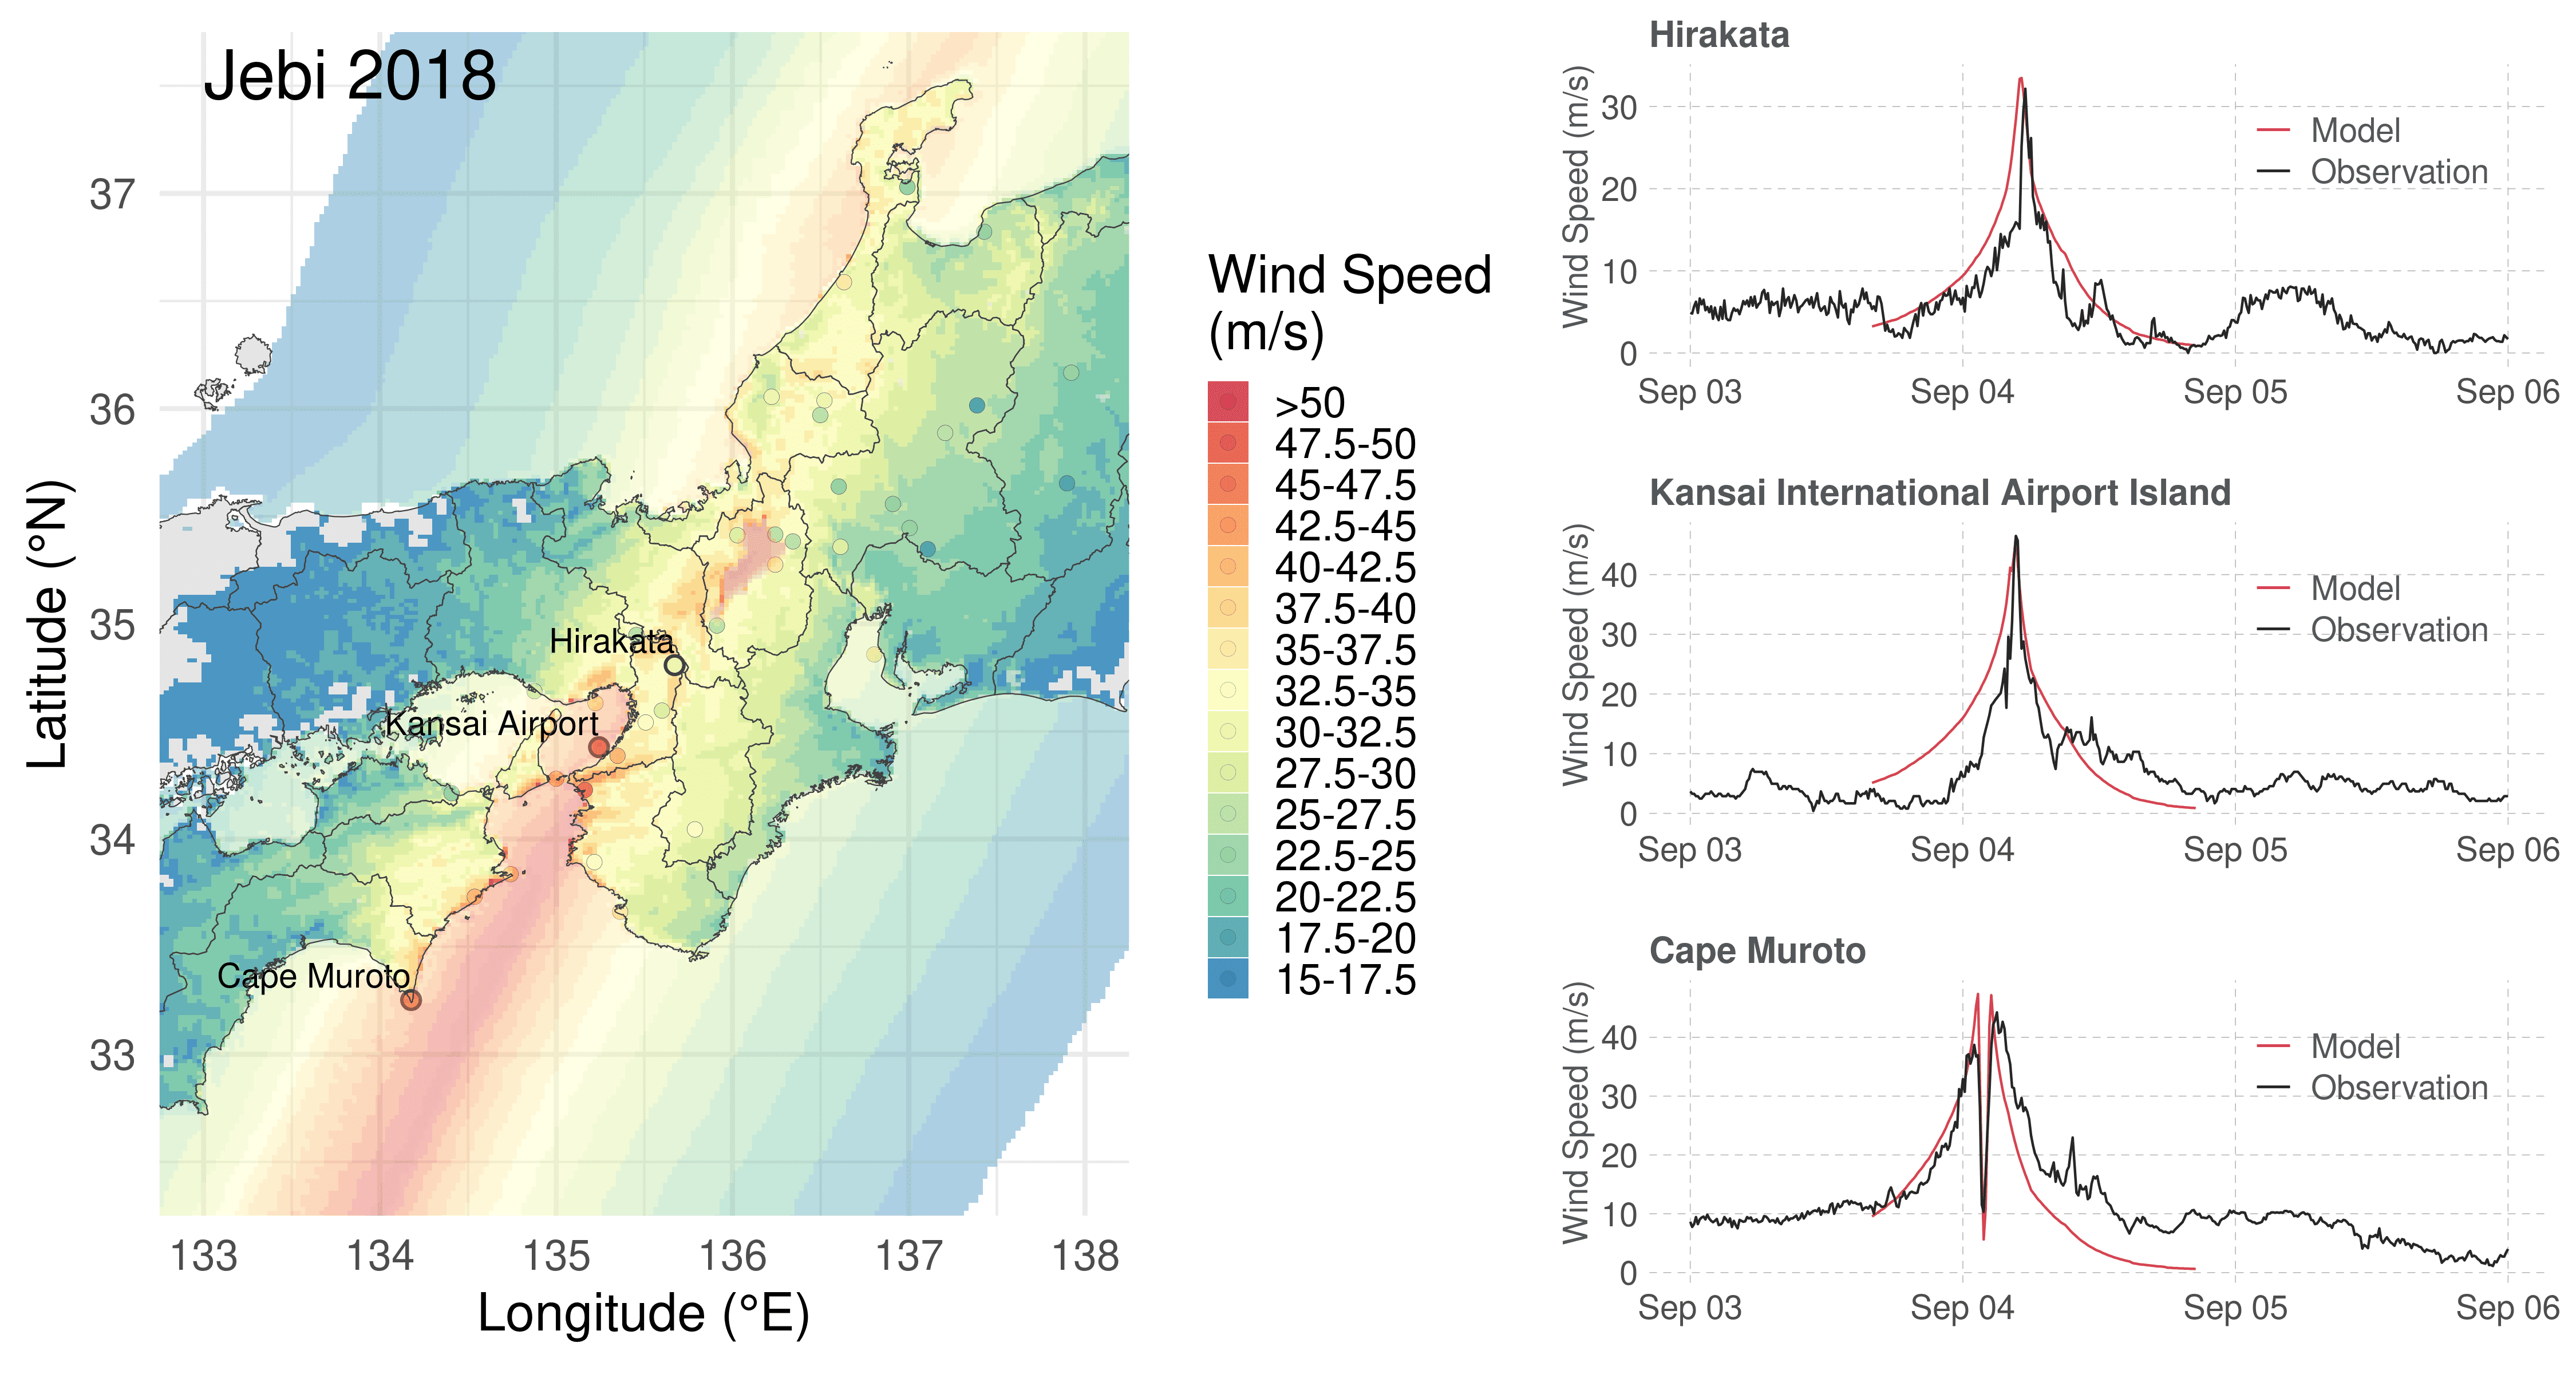
Wind field map of Typhoon Jebi 2018 (PartnerRe & NCAR, 2020). All the maps in the article below can be opened to zoom/filter/explore.
A look back at extreme wind events from the last 100 years uncovers six Japan typhoons – hereafter, the “Big-6” – that would cause severe industry losses given current exposure. Our analysis ranks Jebi 2018 in fourth place. In addition, typhoon-triggered flood events like Ida 1958 can also cause severe losses. Combined, these findings suggest that the return period of a Jebi-sized insurance industry loss is approximately 20-25 years.
To aid discussions on this topic and given the importance of Jebi 2018 as a risk assessment benchmark, we present estimated losses and modeled wind fields for the Big-6. The wind fields are based on an advanced, high-resolution boundary layer model. They are amongst the most accurate representations of these storms currently available.
Key findings
In collaboration with the National Center for Atmospheric Research (NCAR), PartnerRe’s Catastrophe Research experts analyzed wind fields and loss scenarios for the most extreme historical (last 100 years) wind events to impact now heavily exposed areas of Japan.
The analysis utilized NCAR’s high-resolution boundary layer model which resolves the complex influence of Japan’s topography on local wind speeds1.
Given current exposure, Jebi’s modeled loss ranks 4th out of the top 6 historical wind events. Jebi is exceeded by Vera 1959, Nancy 1961 and Muroto 1934.
Typhoon flood events such as Ida 1958 can also cause Jebi-sized losses2.
Combined, these findings suggest that the return period of a Jebi-sized loss is approximately 20-25 years.
The Big-6
Typhoon Jebi made landfall in Japan on September 4, 2018, as a category 3 storm3, bringing severe winds to the highly exposed Kansai region around Osaka. The estimated insured industry loss of this wind event currently stands at USD 13-14 billion4. As Jebi 2018 followed several decades without extreme wind losses, initial (empirical) return period estimates for Jebi were often set at over 50 years.
Looking at the last 100 years, however, the climatology tells a different story. Our analysis identified five other historical storms which caused comparably severe wind speeds in high exposure areas: Muroto 1934, Jane 1950, Vera 1959, Nancy 1961 and Mireille 1991. The tracks of these “Big-6” storms are shown in figure 1. For more information on how these storms were selected, see box at the end of this article, “Identification of the Big-6”.
State-of-the-art wind fields
This paper presents the first detailed wind fields (or “footprints”) for all six identified storms based on an advanced high-resolution numerical boundary layer model (see figures 2 and 3). The model, developed and run by scientists at the US National Center for Atmospheric Research (NCAR), models surface wind speed at greater accuracy than a simple parametric model and considers the impact of Japan’s complex topography on surface winds. The wind fields are amongst the most accurate available representations of these storms. For more information on the model, see box “The NCAR Model” at the end of this article.
Loss potentials and rankings
PartnerRe’s proprietary CatFocus® Japan Typhoon model was used to evaluate the loss potential of the Big-6 storms given current exposure values.
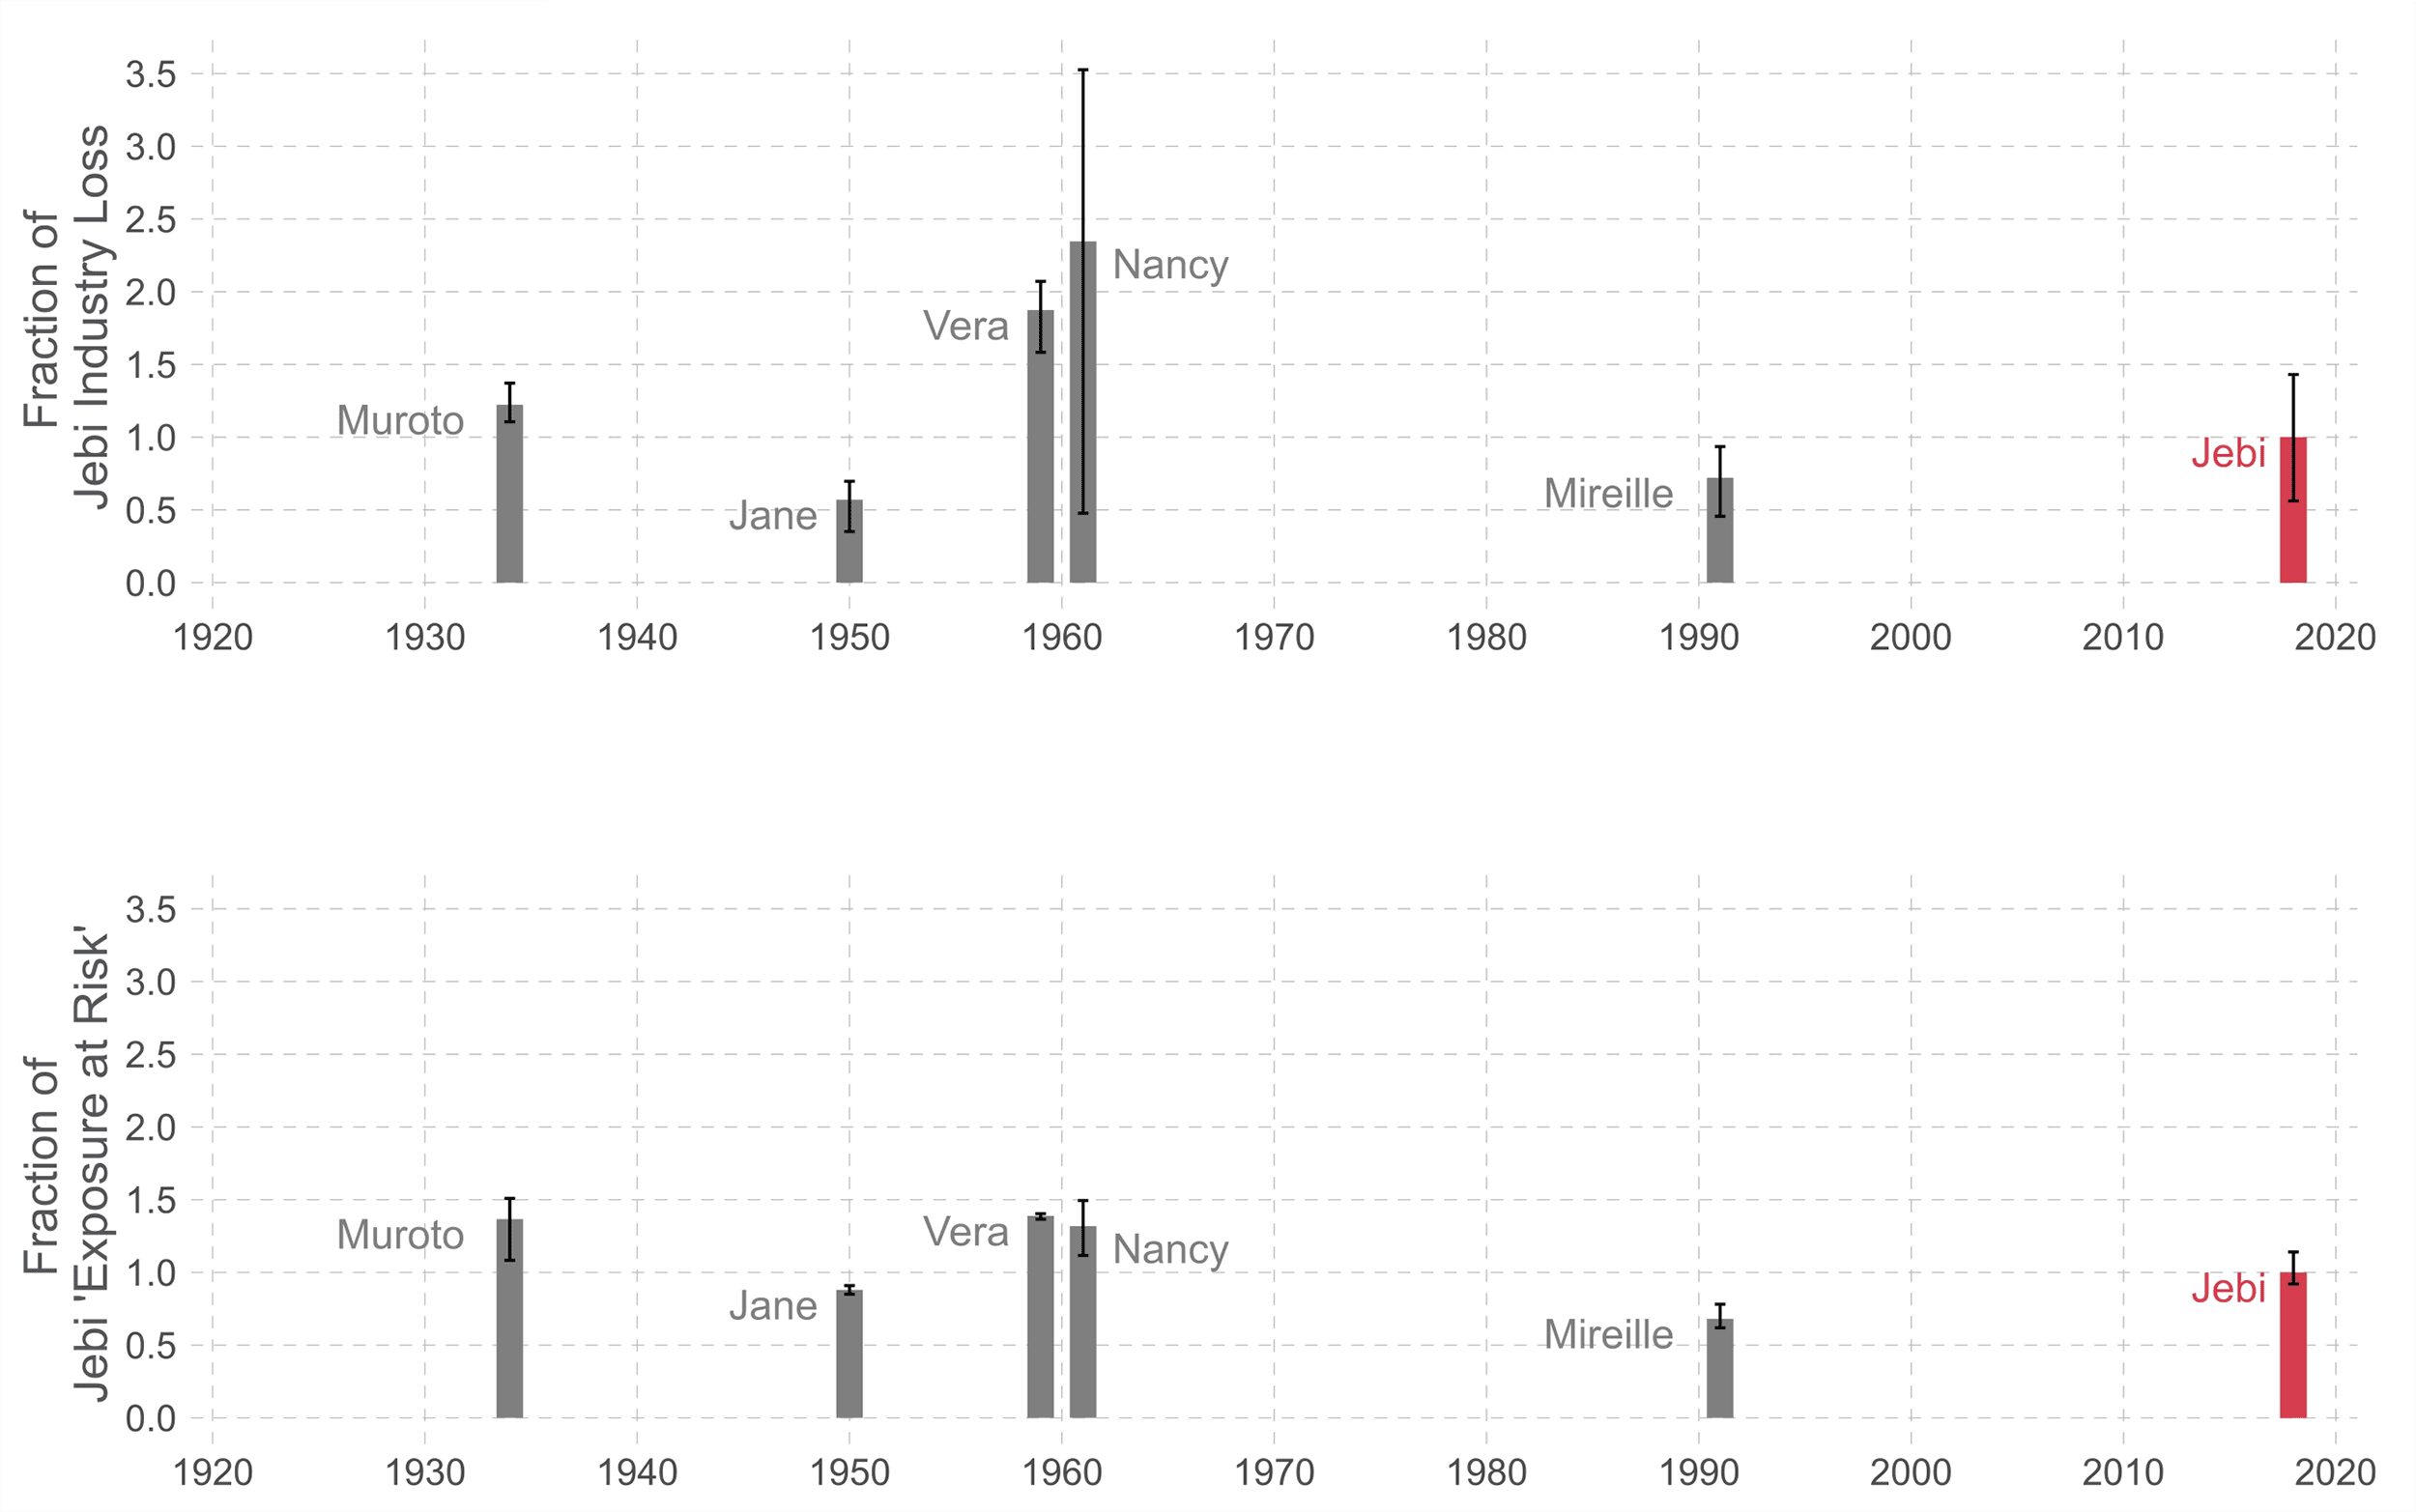
Specifically, CatFocus® combined the NCAR model wind fields with industry exposure and wind vulnerability data, to derive mean loss estimates and exposure at risk5. As shown in figure 4, Jebi 2018 ranks fourth for both metrics.
Muroto 1934, Vera 1959 and Nancy 1961 rank higher than Jebi due to their stronger and more widespread winds over high exposure areas. Jane 1950 and Mireille 1991 rank lower: Jane impacted a similar exposure area to Jebi, but had lower wind speeds; Mireille had higher wind speeds over land than Jebi, but impacted a lower exposure area.
Additional impact of flood
Although this analysis focused on typhoon wind events, the contribution of typhoon-triggered flood is also significant. For example, three of the identified Big-6 storms – Muroto 1934, Vera 1959 and Nancy 1961 – were also associated with a damaging storm surge component that would further increase their present-day loss potential. In addition, extreme rainfall, a known peril from other extreme storms from the last 100 years, e.g. Ida 1958, Kathleen 1947 and Hagibis 2019, can cause substantial losses even if the storm’s wind impact is moderate. A reconstruction of Ida 1958 at current exposure would result in a higher magnitude of loss than Jebi 20182.
Estimated return period
Combined, the findings – based on the available historical record – suggest that the return period of a Jebi-sized loss is approximately 20-25 years. As shown in figure 4, severe wind losses have occurred with a multiple-decade hiatus, but can also occur in short succession, as demonstrated by Vera 1959 and Nancy 1961.
The storms for your own exploration
We are pleased to make the storm tracks and wind fields of this analysis available to you for your own exploration. Please click on the images below to zoom and move around the maps.
To download the wind field data (NetCDF format only), click here.
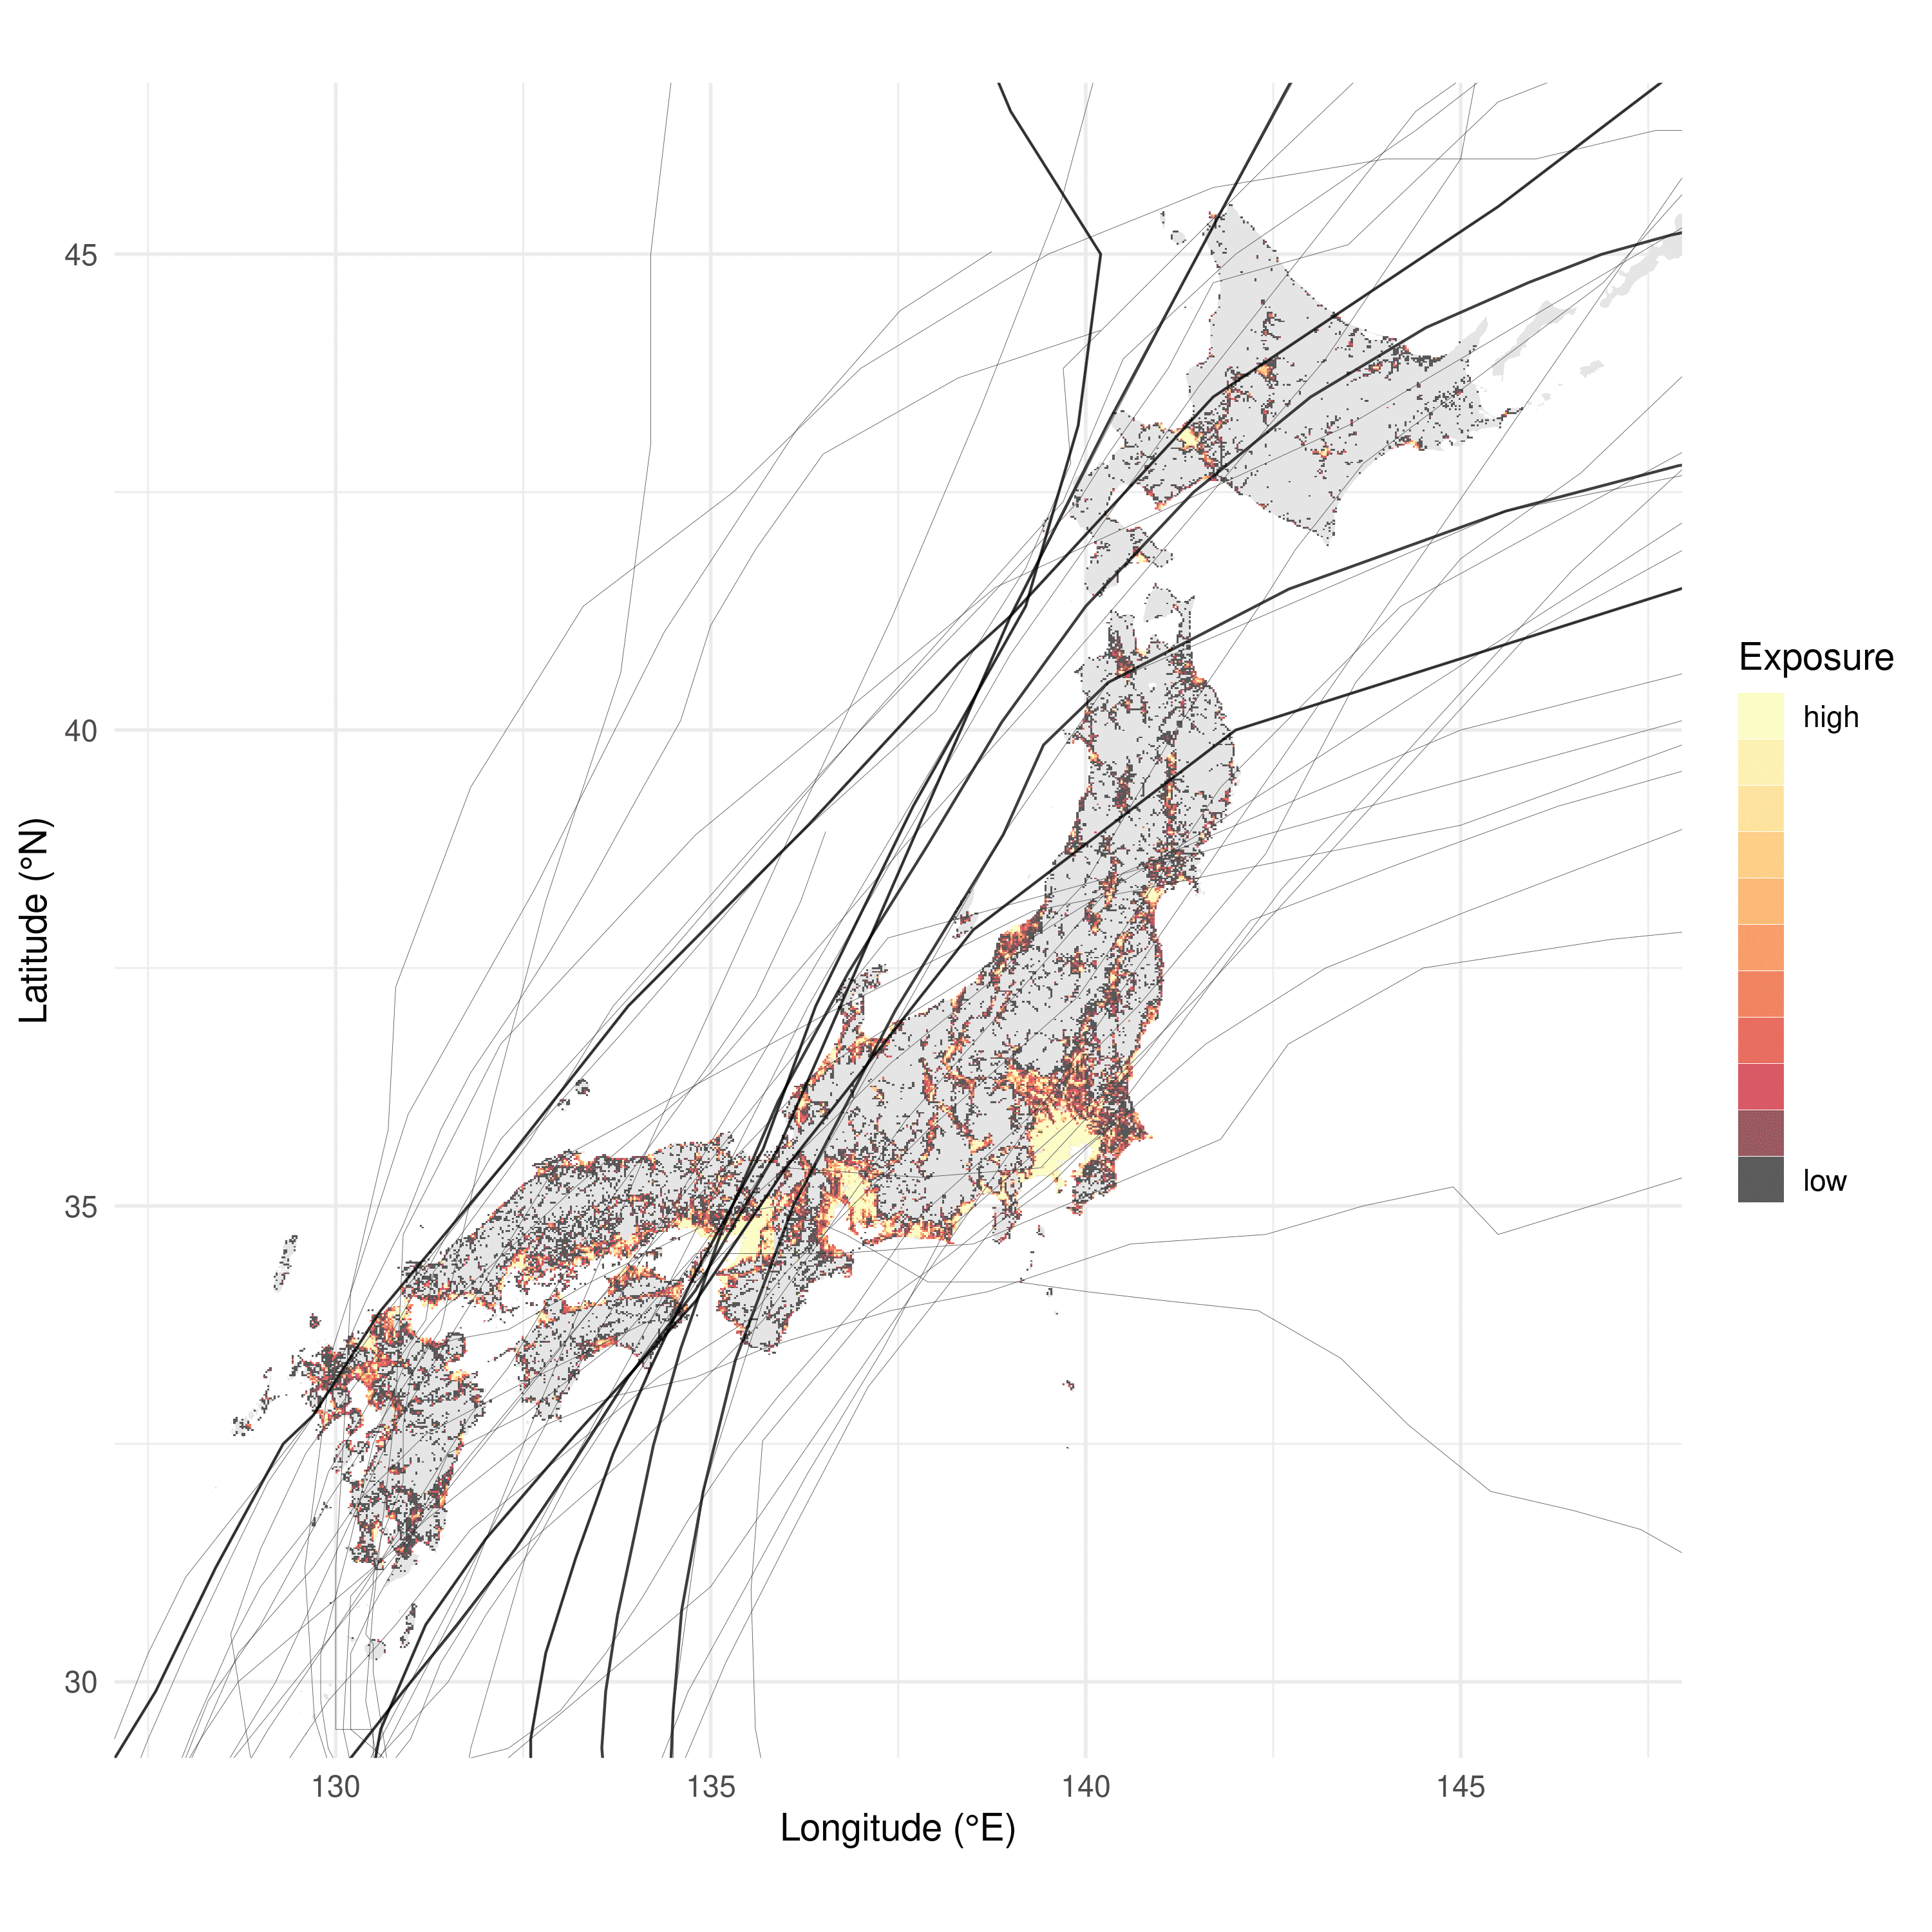
Figure 1: Tracks of (mainland Japan) land-falling historical storms of category 3 and above strength3 winds recorded since 1920. Those with the potential to meet or exceed Jebi 2018 wind losses given current exposures (colored areas) on mainland Japan – the “Big-6” – are shown as thick lines (Jebi 2018 included). Note, several storms tracked over the Greater Tokyo area, but these had substantially weakened by this point. For more details on the identification criteria for the Big-6 storms and utilized track datasets, see box below, “Identification of the Big-6”. Source: PartnerRe, JMA6, Kumazawa et al12.
Figure 2: Jebi’s wind field and model validation. The map on the left shows the modeled wind field for Jebi 2018, i.e. the maximum 1-minute sustained wind speed at each grid point (2 kilometer resolution) during the passage of the storm. Colored circles indicate observed wind speeds at Japan Meteorological Agency (JMA) observation stations6. The graphs on the right show the temporal evolution of the modeled (red) and observed (black) 1-minute sustained wind speeds at the three JMA observation stations labeled on the map. There is strong correlation between the modeled and observed values, validating the model’s reliability. Source: PartnerRe and NCAR.
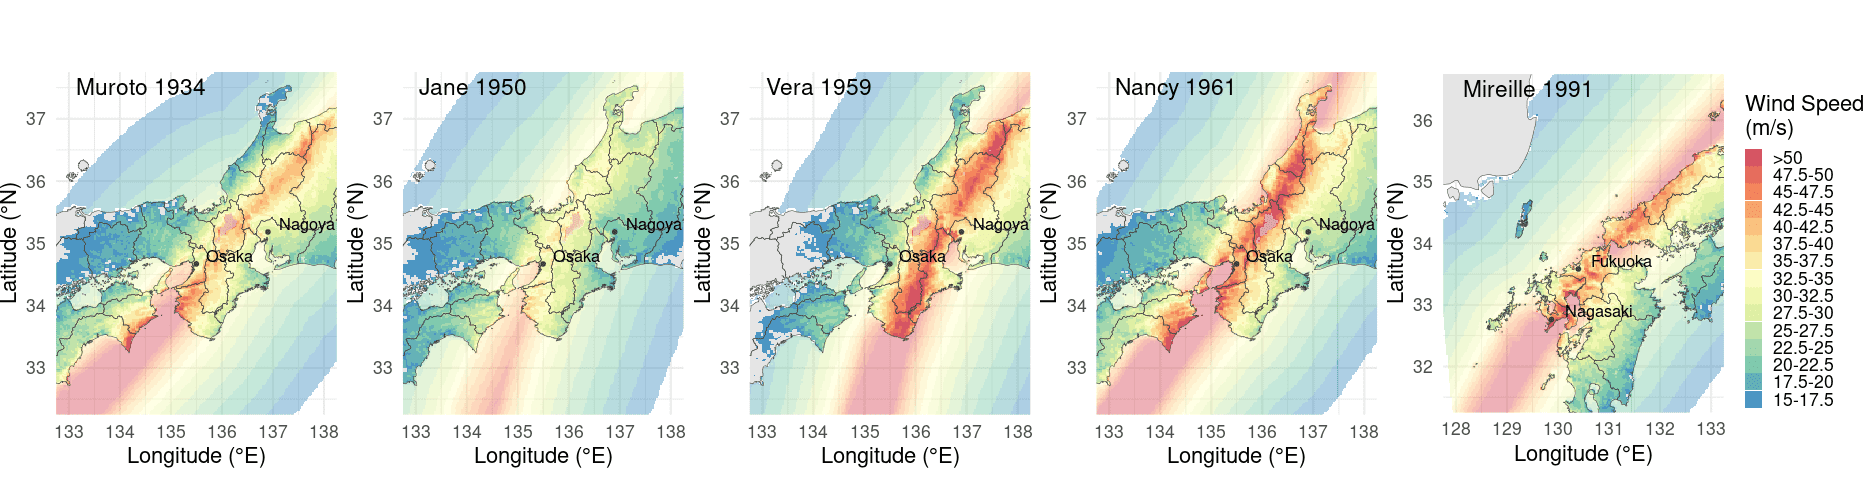
Figure 3: Modeled wind fields of the other five extreme historical wind events since 1920 with the potential to meet or exceed Jebi-sized losses given current exposure. Source: PartnerRe and NCAR.
Figure 4: Modeled insurance industry losses (top graph) and exposure at risk (lower graph) for the Big-6 storms since 1920. The estimates are expressed relative to Jebi 2018 and are based on PartnerRe’s proprietary CatFocus® catastrophe model using the wind fields shown in figures 2 and 3 and present-day industry exposure. “Exposure at risk” values are current insured values at locations experiencing at least tropical storm strength3 winds. The modeled results are sensitive to the specific input data7: To explore this uncertainty, sensitivity experiments were conducted for each storm by varying the input data for track, maximum wind speed and radius of maximum wind speed (see error bars for maximum and minimum values). The finding that Jebi ranks fourth out of the Big-6 was shown to be robust. Source: PartnerRe.
The NCAR Model
This “state-of-the-science” model1 combines a parametric wind field model8 with a 3-dimensional numerical boundary layer model9. Numerically modeling near-surface winds produces a much finer-scale wind field variability in response to variable surface roughness and terrain height. For example, winds accelerate up windward slopes and over mountain crests, and decelerate over the high surface roughness of urban areas. The modeling system was thoroughly tested over hundreds of global historical events, producing simulated wind fields which compared favourably with surface station observations; with a mean model bias close to zero1. The model is therefore well suited to capturing the effects of Japan’s complex terrain on the surface wind field of historical land-falling typhoons.
Dr. Cindy Bruyère, Dr. James Done and Ming Ge, all of NCAR.
Identification of the Big-6
Using the following datasets, we identified other historical wind events with the potential to cause Jebi-sized losses: best track dataset IBTrACS10,11 and the Kumazawa et al. 201612 dataset. Combined, the two datasets cover all storms impacting (making landfall on mainland) Japan since 1920 based on observations by the Japan Meteorological Agency (JMA)6 and its predecessor institution.
Overall, our Big-6 includes five storms with category 3 or stronger3 winds at landfall in current high exposure areas, and one, Jane 1950, which was an upper-end category 2 storm impacting Osaka. The analysis also showed that the urban areas of Osaka and Nagoya are historically most at risk.
There have also been several category 3 or stronger landfalls in Kyushu (southern part of mainland Japan), including Ida 1945, Yancy 1993 and Songda 2004. However, we judged the wind loss potential of these events to be lower than Jebi since none of the main exposure areas of Japan were directly impacted by the storms’ most severe winds. In addition, several of the storms, e.g. Maon 2004, track over the Greater Tokyo area, but all had weakened substantially by this point.
Acknowledgment
With thanks to the US National Center for Atmospheric Research (NCAR) for the excellent collaboration in developing the wind fields for this analysis.
Contributors
Dr. Martin Frischknecht, Researcher, Catastrophe Research
Dr. Niklaus Merz, Researcher, Catastrophe Research
Dr. Paul Della-Marta, Head of Catastrophe Research
Contact us
We hope you found this information useful. Please contact us if you would like to discuss this topic with us and/or to investigate the impact of the described storms on a specific risk portfolio.
This article is for general information, education and discussion purposes only. It does not constitute legal or professional advice of PartnerRe or its affiliates.